Project Overview
!!!Currently Working on Data Analysis for WEC Races!!!
This Project is currently ongoing and explores the processing and analysis of various motorsport data
provided by openF1 API endpoints and "alkamelsystems". It aims to build a holistic and interactive
dashboard that can be utilized to view and analyze data of any session, from any driver in any lap to
gain insights into performance, lap time and on-track events.
Race cars produce an incredible amount of data. Telemetry sensors, system management, gps data and
much more, are all broadcast constantly throughout any session. Analyzing this data and extracting
key information requires both engineering expertise and analytical insight, to derive meaningful
strategies. This project aims to leverage data science techniques to extract meaningful patterns
from Motorsport data, to be able to quickly gain actionable insights and improve on-track performance.
Through my engineering background I was able to create meaningful graphics that are relevant for
improving performance and monitoring component functionality and health. I am currently working on
building the interactive dashboard around these graphics, so that a user-friendly interface exists,
to quickly gain insights into these vast amounts of data.
Methodology
The analysis was conducted using Python with libraries including openF1 for data acquisition, Pandas for data manipulation and Seaborn & Matplotlib for visualization.
The methodology included:
- Event & Session based data collection from various openF1 API endpoints
- Exploratory data analysis to identify key metrics and graphics that are relevant for the dashboard
- Data preprocessing to merge various data sources, to optimize calculation performances
- Interactive Dashboard development using Streamlit
Example Visualizations
Visualizations play a crucial role in quickly understanding data and understanding critical patterns.
During this project various visualizations were created, with a few examples below:
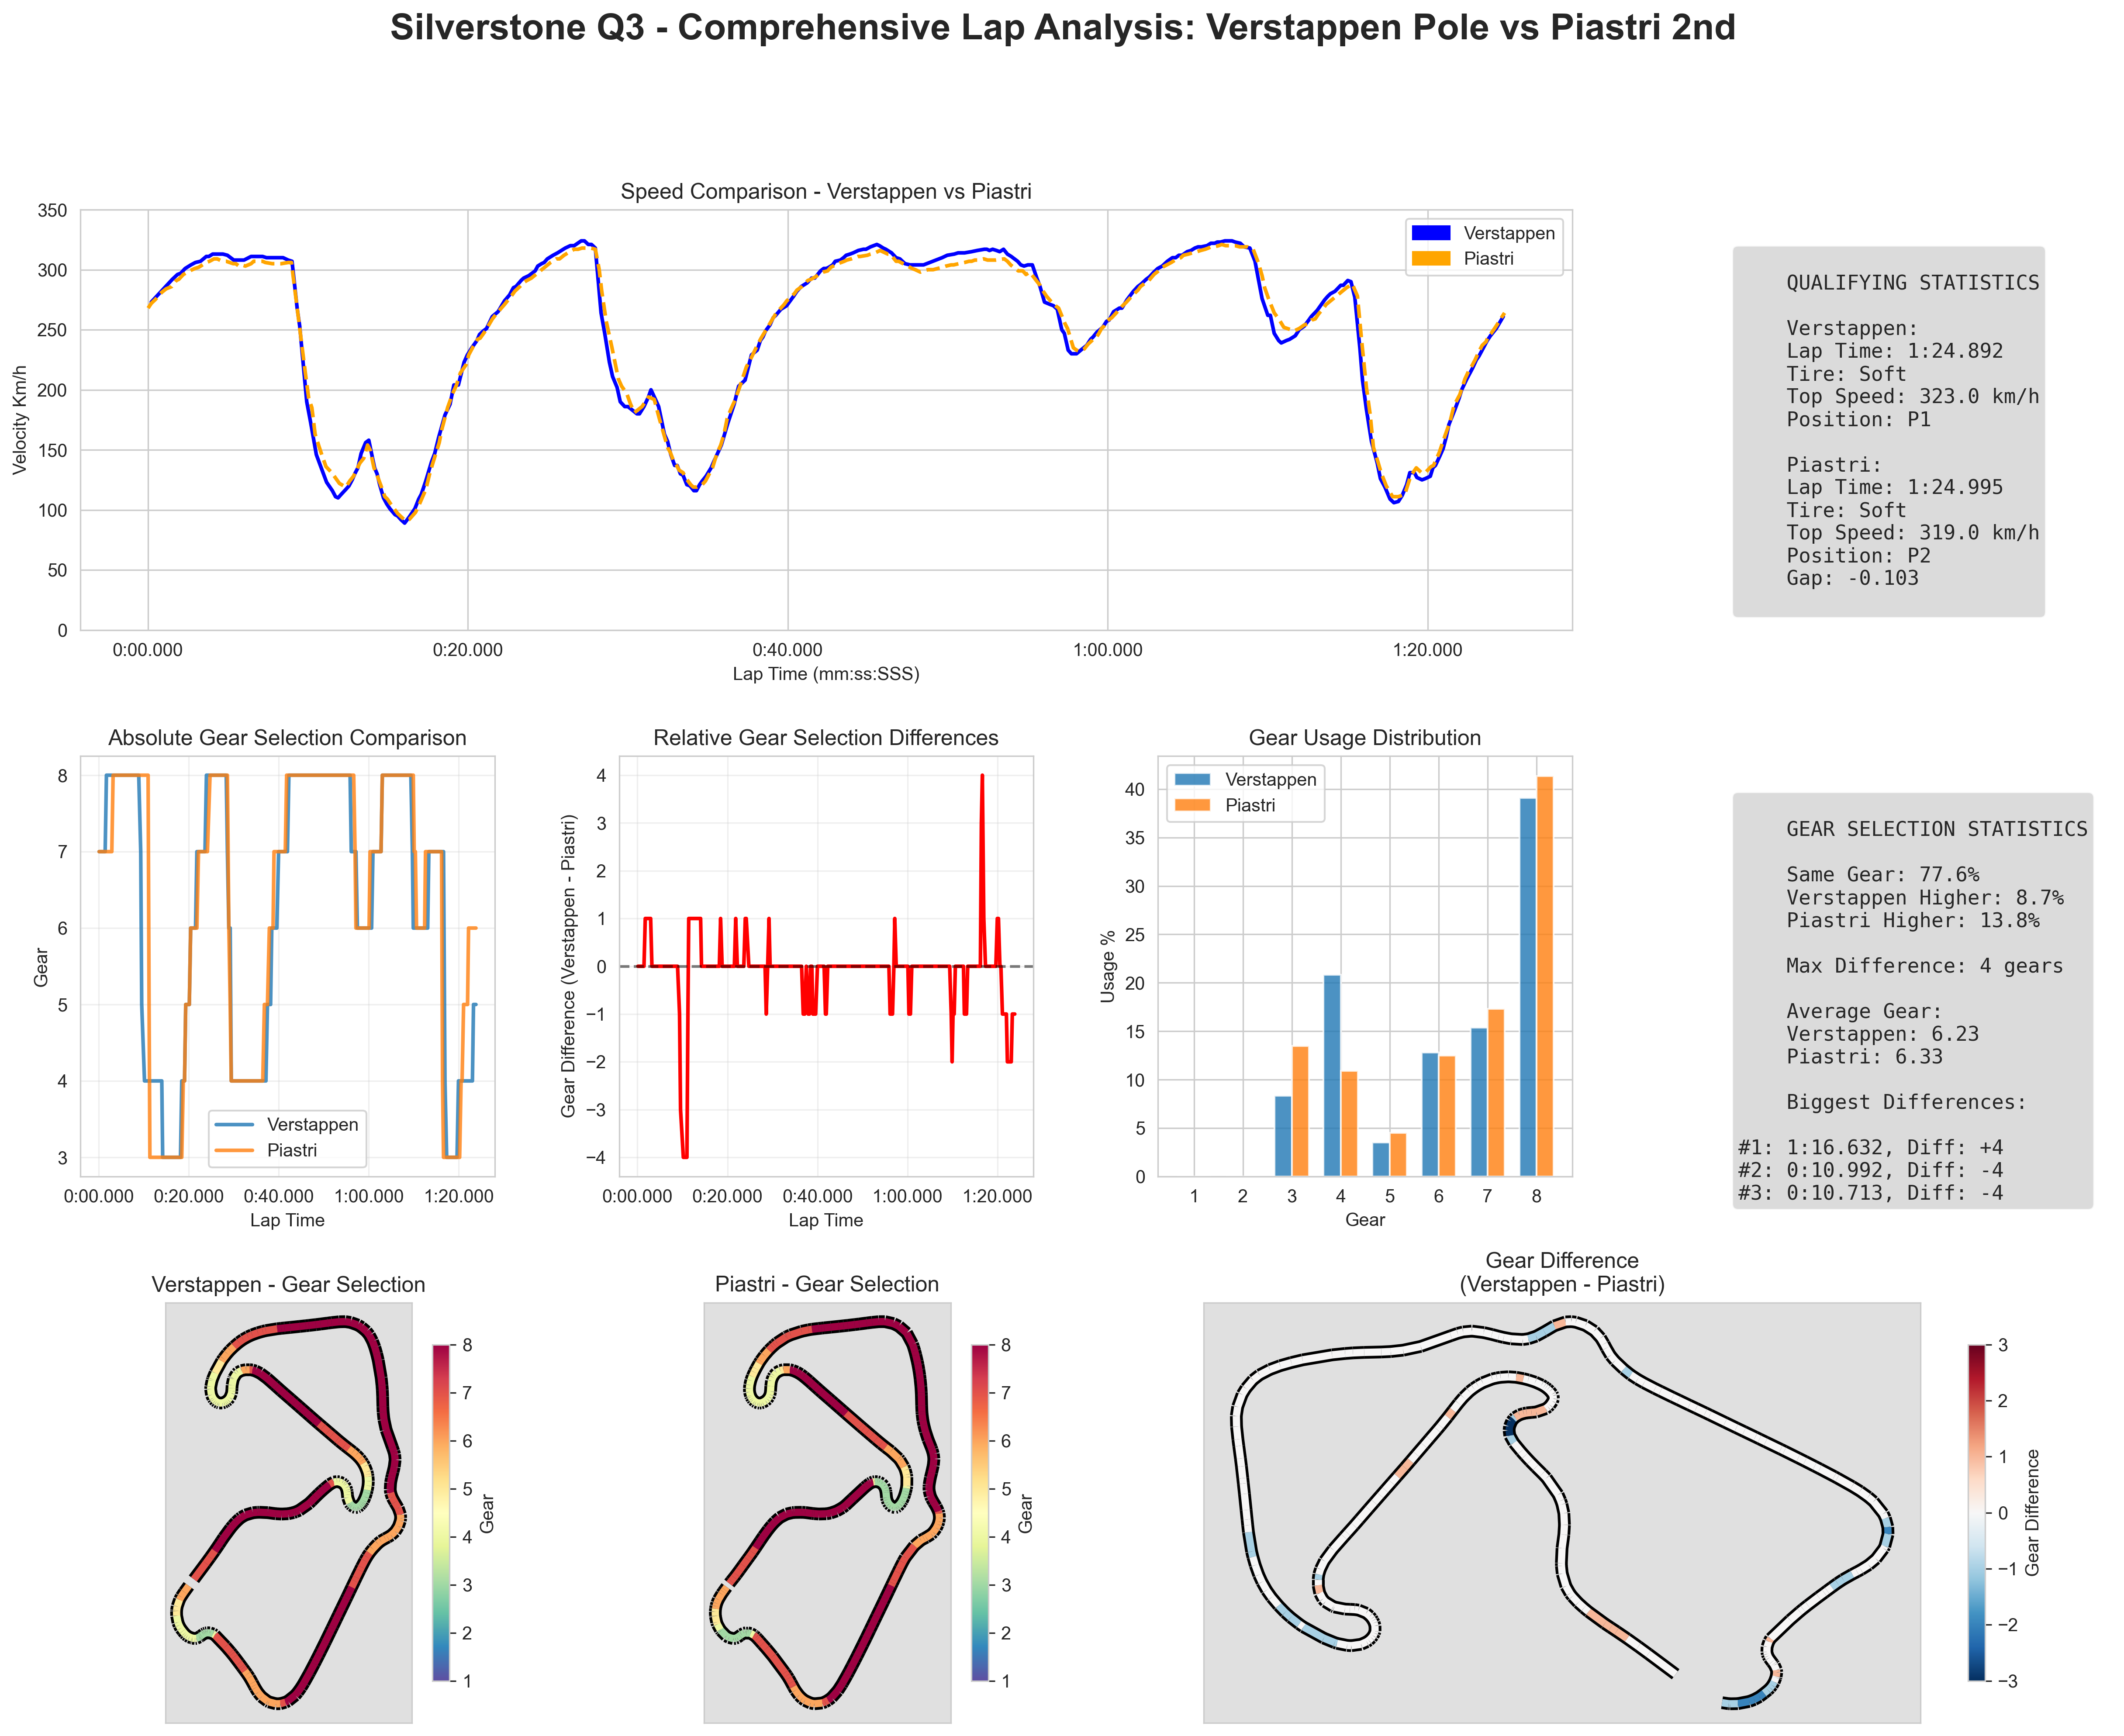
Single Lap telemetry dashboard comparing the qualifying laps of Verstappen and Piastri at Silverstone.
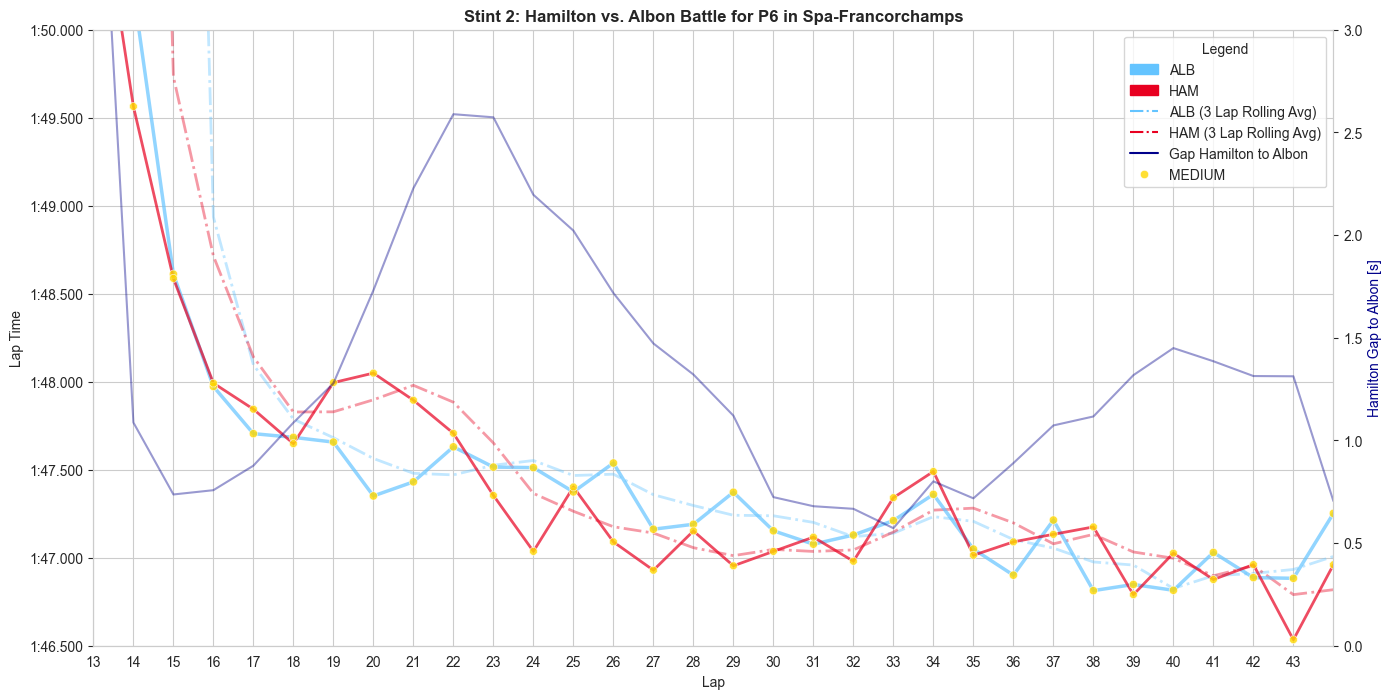
Lap Time, Consistency and Time Delta comparison for the dry stint of Albon and Hamilton during Spa 2025.
Driver Lap Times of the Catalunya Qualifying, with corresponding tire compound and qualifying position.
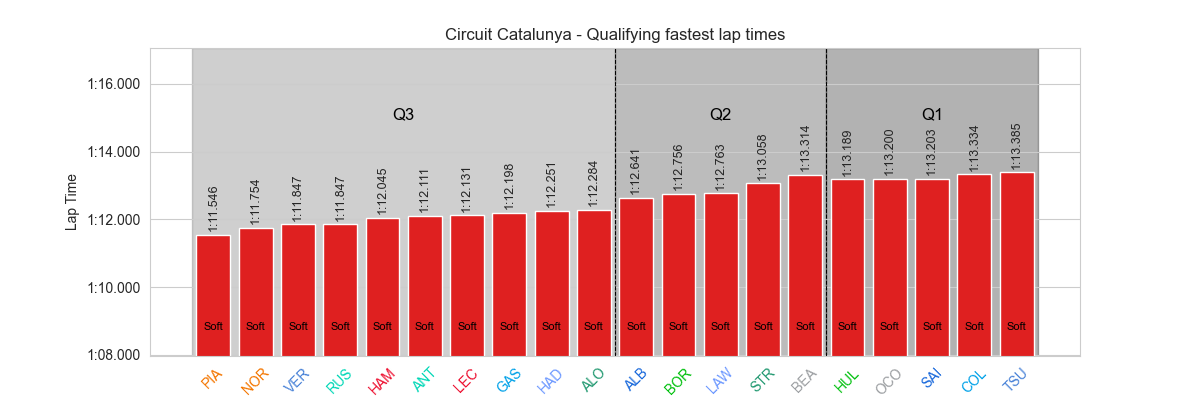
Driver Lap Times of the Catalunya Qualifying, with corresponding tire compound and qualifying position.
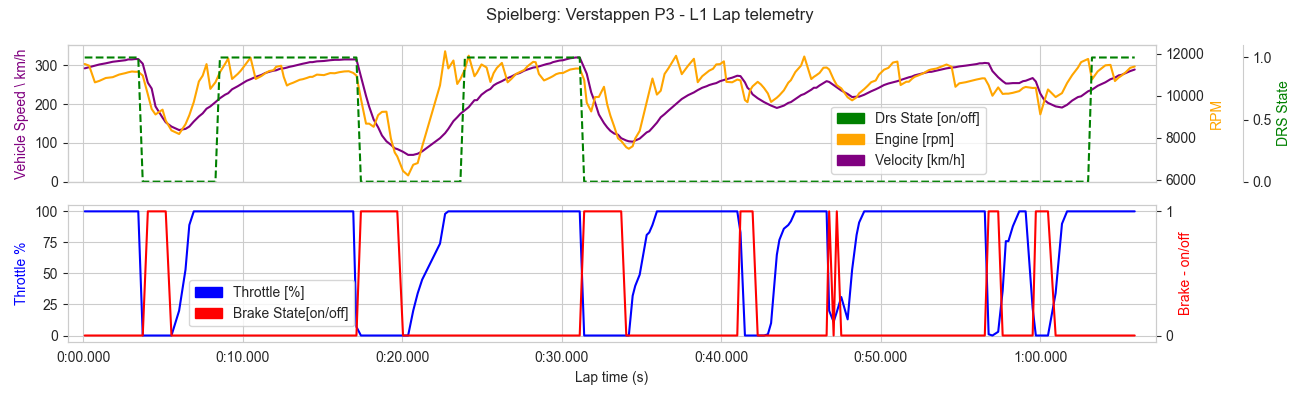
Single lap Telemetry of Max Verstappen during free Practice 3 in Spielber.
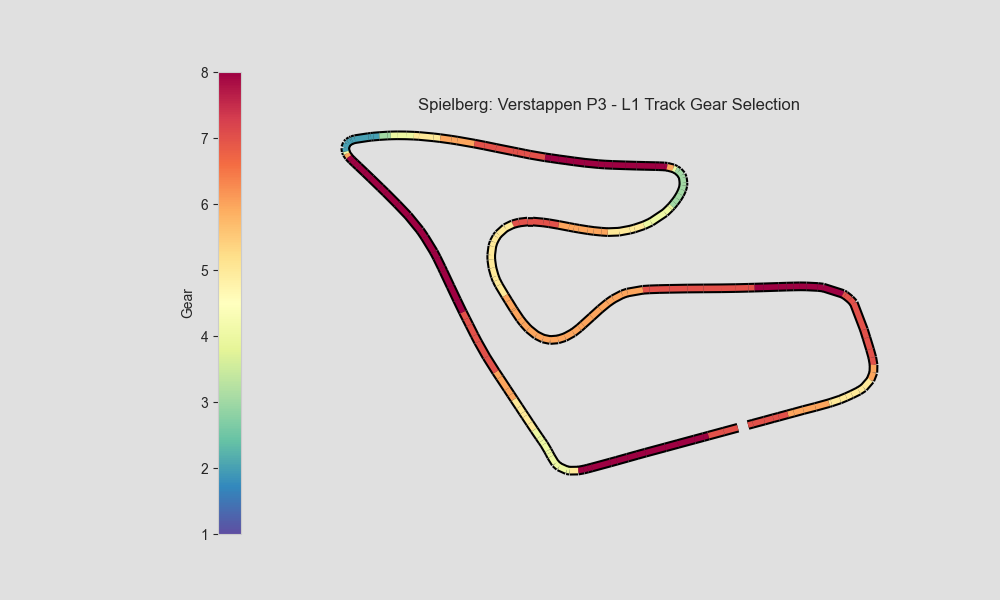
Location based gear selection during a single lap.
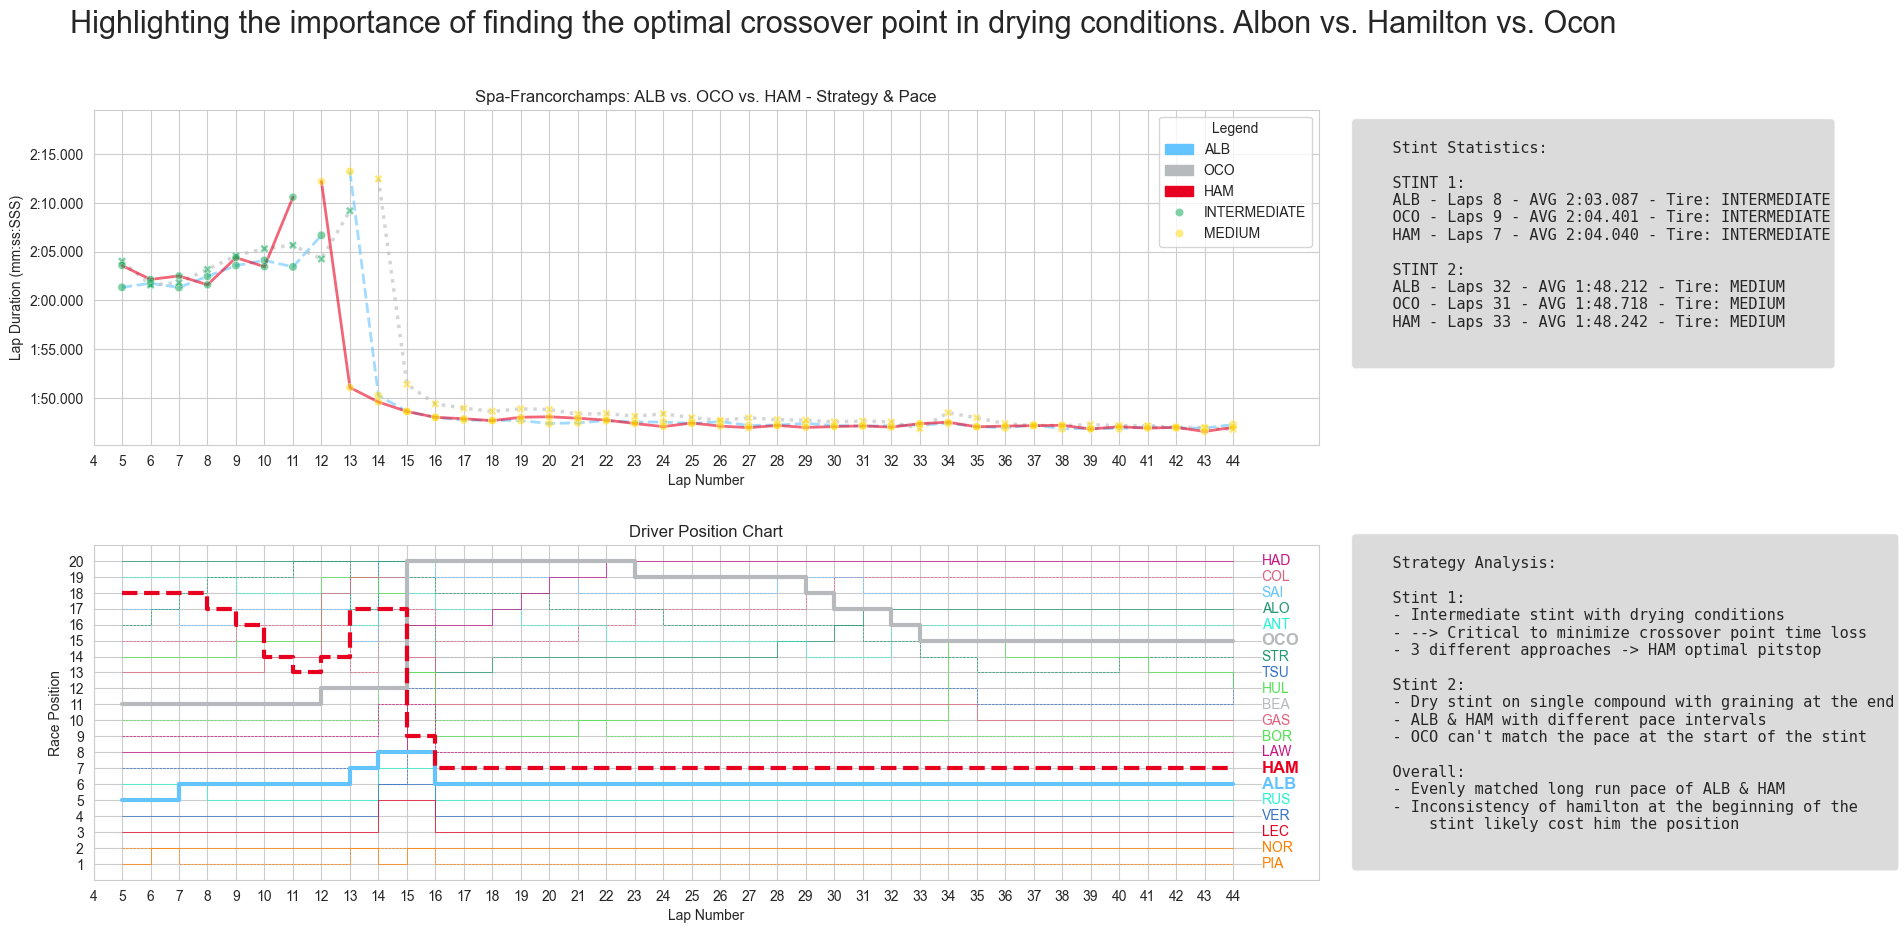
3 Different pit strategies for the cross-over point from Wet-Dry during Spa 2025.
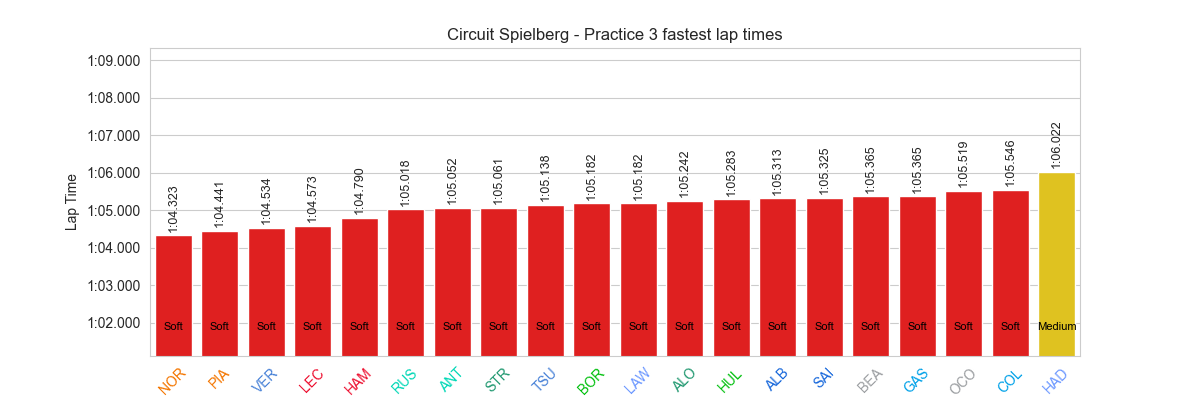
Fastest laps in a given session with the corresponding tire compound and the driver position.
On the horizon
My next goals for this project are outlined below:
01
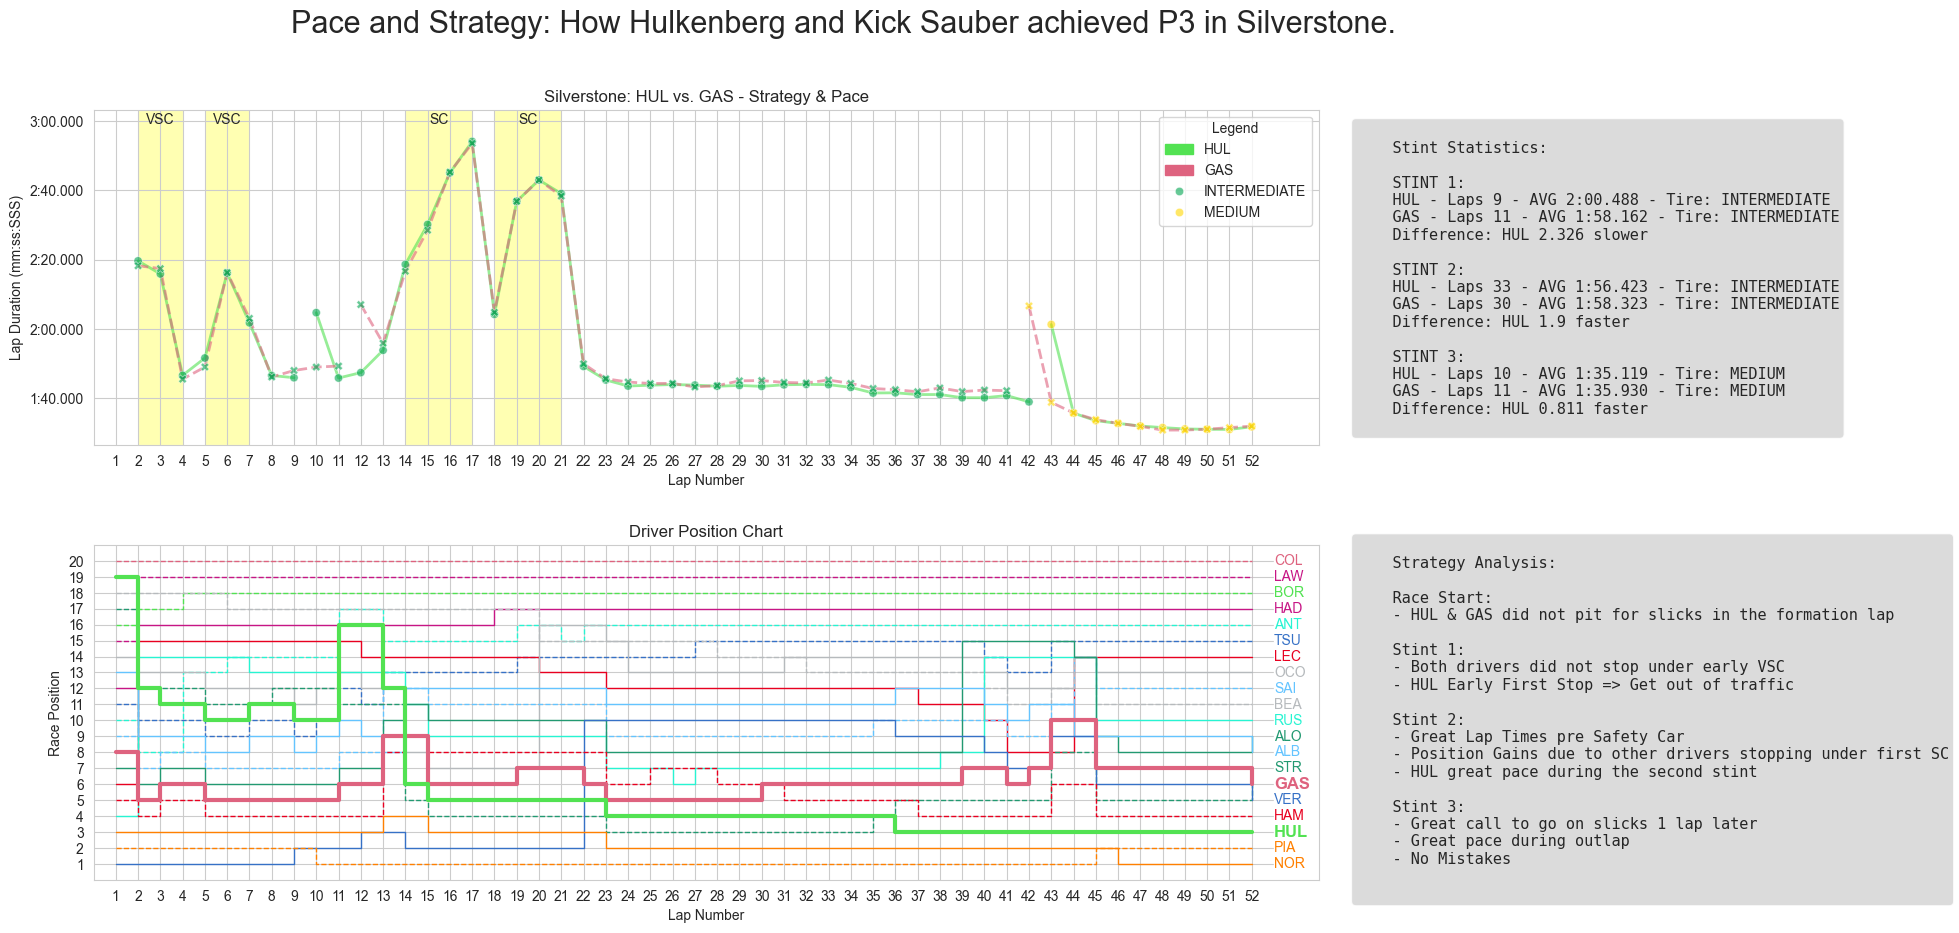
Race Position graphic
Graphic that visualizes all drivers race positions across the whole race.
02
Stint Data
Visualize Lap time degradation across stints and show average lap times
in a session, based on tire compound.
03
Updated Track Map
Show the lap time, as well as the wind velocity and direction on the
gear selection track map.
04
Telemetry Comparison
Provide the possibility to compare the lap telemetry from 2 previously
selected laps, to compare consistency by a driver or find differences in driving style across
drivers.
05
Pit Stop Losses
Visualize average pit stop times and check for position losses because
of bad pit stops.
06
Dashboard
Wrap all functionalities in an interactive dashboard that makes the
application user-friendly and easy to read.
Conclusion
As I am currently still working on this project, the conclusion is still limited.
This project demonstrates the value of applying data science techniques in motorsports.
By combining data engineering methods with statistical approaches it was possible to extract
meaningful patterns from complex telemetry data and derive meaningful actions.
The insights gained from this analysis could help engineers make more informed decisions and
understand vehicle dynamics and telemetry in greater depth.