Project Overview
This project explores US Stock market data from 2019-2024, focusing on in-depth analysis of tech stock performance, market trends, and future predictions. Using advanced data science techniques and machine learning models, I conducted holistic price development analyses of multiple tech stocks, individual comparisons between trade volume and stock prices, and volatility analyses of financial markets including selected cryptocurrencies.
The financial markets generate vast amounts of data every day, and making sense of these patterns requires both technical expertise and analytical insight. This project aimed to leverage data science and machine learning techniques to extract meaningful patterns from US stock market data, with a particular focus on technology stocks during the volatile 2019-2024 period.
By analyzing historical price movements, trading volumes, and market volatility across different sectors, I developed models that could identify correlations between different market behaviors and potentially predict future movements. This project demonstrates the power of data-driven approaches in understanding financial markets and making informed investment decisions.
Methodology
The analysis was conducted using Python with libraries including Pandas for data manipulation, Seaborn and Matplotlib for visualization, and PyTorch for building predictive models. The methodology included:
- Data collection to gather historical stock prices, trading volumes, and market indices
- Exploratory data analysis to identify trends, correlations, and anomalies
- Data preprocessing for the machine learning applications
- Development of machine learning models for price forecasting using PyTorch - FFNN and LSTM
Key Visualizations
Visualizations played a crucial role in understanding market dynamics and communicating findings.
The project produced several insightful visualizations that reveal patterns in stock market behavior.
.png)
Comparative analysis of major tech stock price and trade movements (2019-2024)
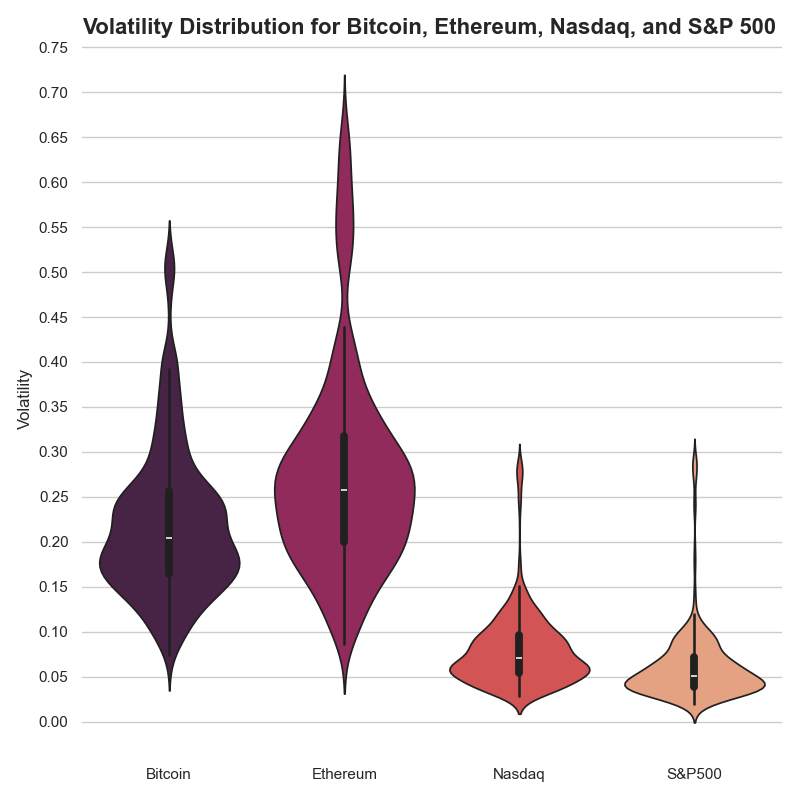
Volatility analysis of traditional financial markets compared to cryptocurrencies
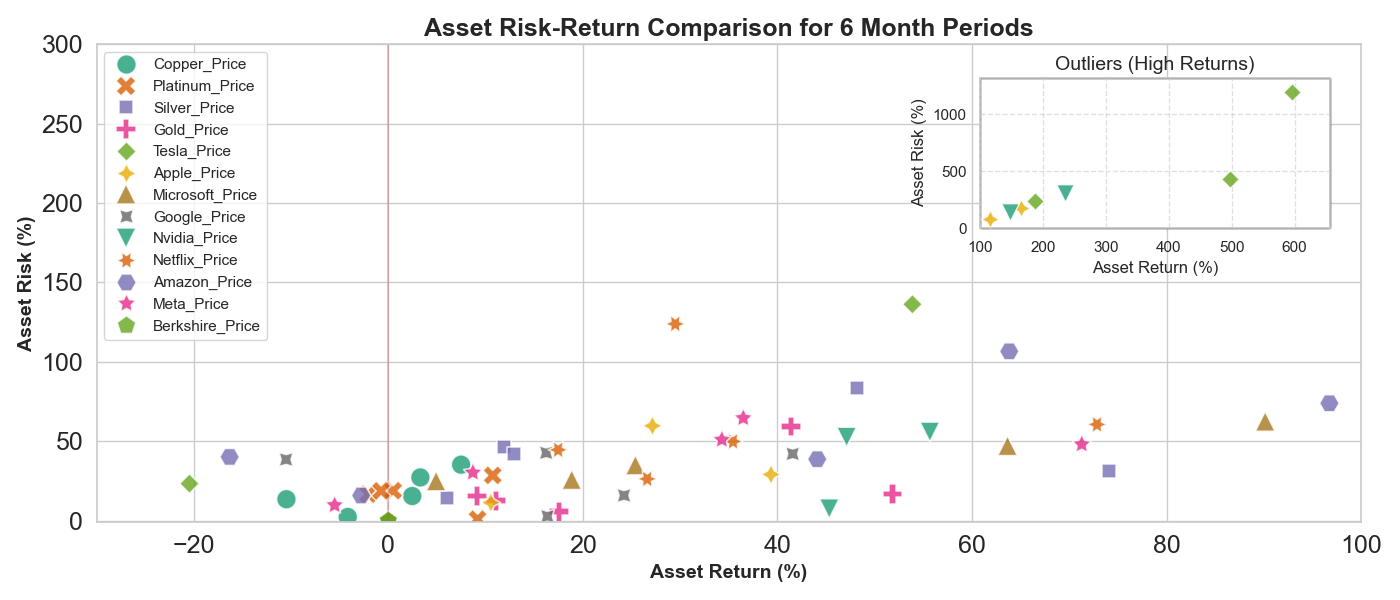
Risk-Return analysis of all major assets in 6 month periods
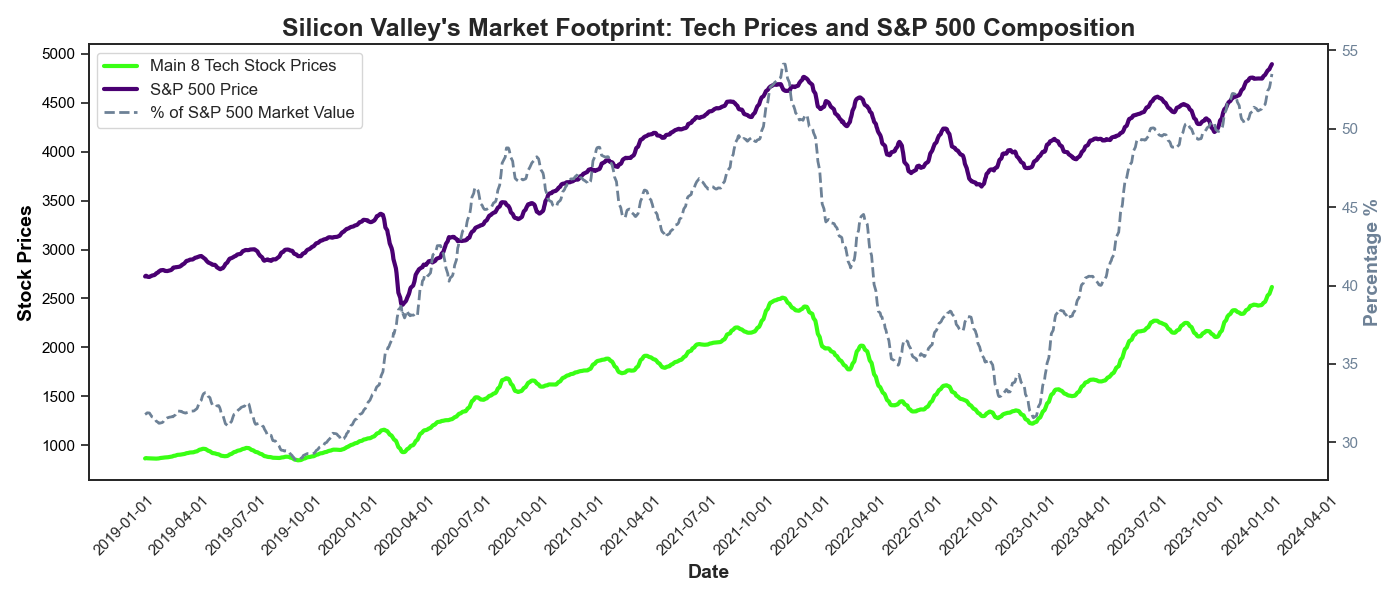
Price and composition analysis of the S&P 500 and the top 8 tech stocks
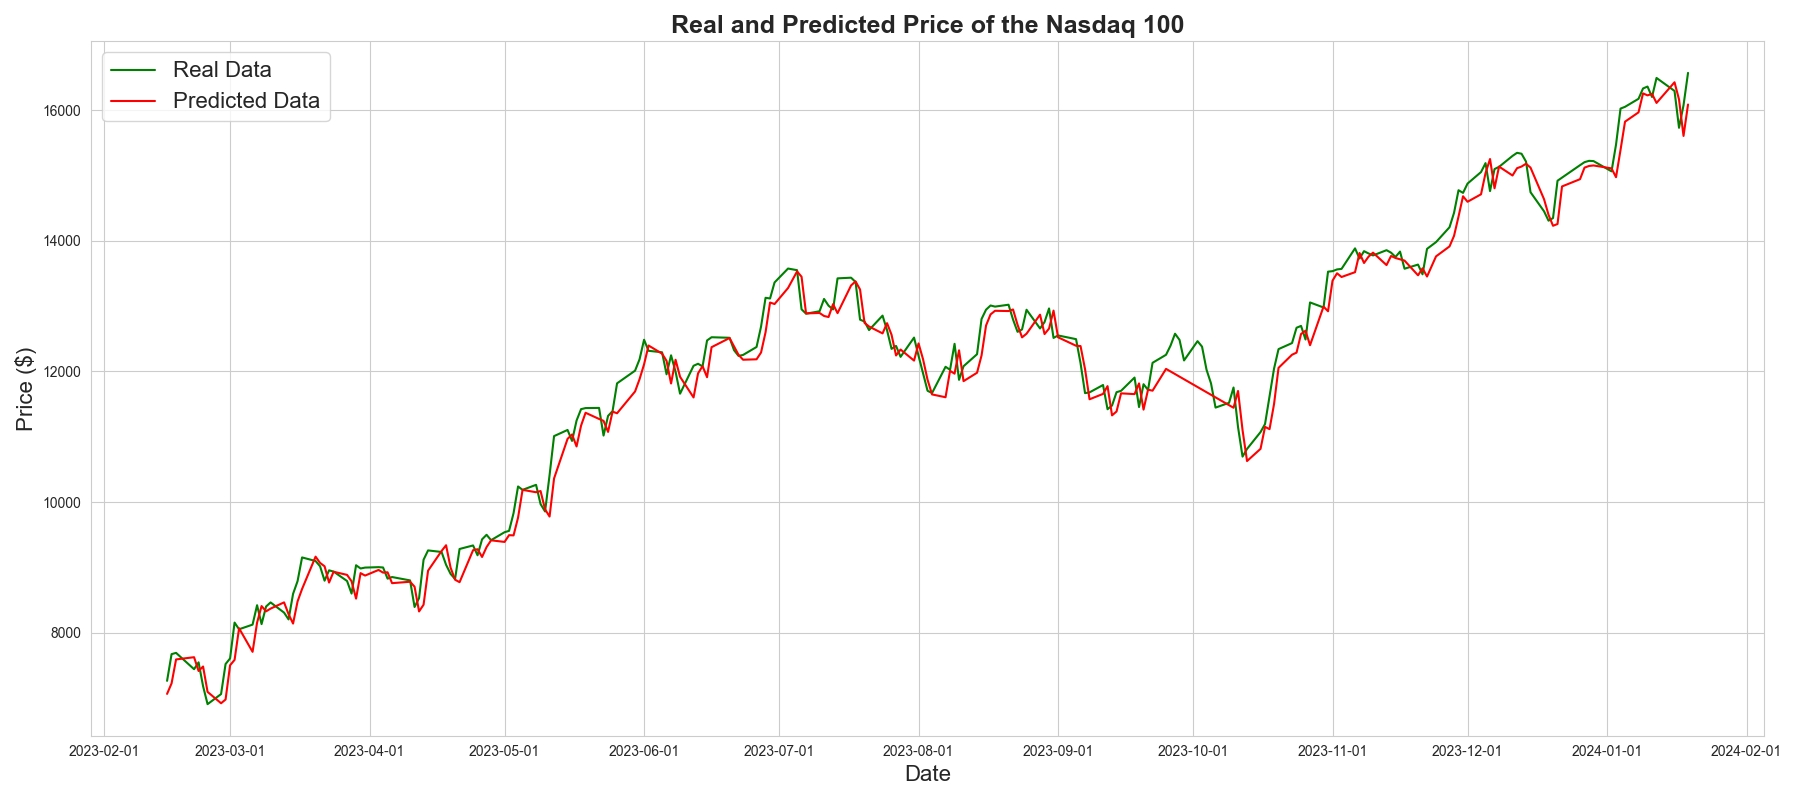
NASDAQ 100 forecasting model showing predicted vs. actual price movements
Key Findings
The analysis revealed several key insights into market behavior during the 2019-2024 period:
01
Nvidia Growth
The Nvidia stock has yielded high returns without major risks in the analyzed time period.
An increased trade volume shows the public's interest in the company.
02
Market Volatility
Even though a general upwards trend in stock prices is noticeable,
investing at the wrong time could lead to significant losses. Further underlining the
importance of long term investments.
03
Cryptocurrency
Compared to traditional financial markets, cryptocurrencies have a
considerably higher volatility making them higher risk investments.
04
Market Composition
The S&P 500 has become more dependent on the performance of the top 8 tech stocks.
The top 8 tech stocks make up 55% of the price, while only representing 1.6% of companies in the S&P500.
05
Physical Assets
Investing in physical assets can yield constant and risk-free returns.
Gold and silver showed promising returns, while copper and platinum were bad investment options.
06
Apple stability
Apple has one of the least volatile stocks on the market, while also having valuable returns.
Low price fluctuations as well as low trade volumes indicate potential long-term investments.
A steady price growth without major dips are key factors when looking at long-term holding.
.png)